Cleveland Safety Statistics

Year
End
Death TCR LWC R/DWC OIRC Total
LW Days
Total
R/T Days
E.M.R. Hours TRIR LWIR DARTIR FA/MED
Only
Cases
2022 0.60
2021 0 9 0 3 6 0 27 0.55 2402599 0.75 0.00 0.25 30
2020 0 9 2 2 5 49 34 0.52 2101733 0.85 0.19 0.19 18
2019 0 10 1 5 4 60 90 0.50 2991969 0.67 0.07 0.33 34
2018 1 14 1 6 7 12 95 0.49 3042764 0.99 0.07 0.39 39
2017 0 10 0 6 4 0 67 0.54 2046193 0.98 0.00 0.59 10
2016 0 5 1 2 2 6 38 0.62 1695353 0.59 0.12 0.24 18
2015 0 9 0 5 4 0 101 0.62 2370816 0.76 0.00 0.42 6
2014 0 15 1 13 1 150 207 0.57 2488980 1.21 0.08 1.04 36
2013 0 9 1 5 3 180 226 0.79 1576136 1.14 0.13 0.63 25
2012 0 5 0 3 2 0 24 0.84 1206311 0.83 0.00 0.50 15
2011 0 14 0 9 5 0 0.80 1715058 1.63 0.00 1.05 31
2010 0 12 1 8 3 16 0.70 1454263 1.65 0.14 1.10 13
2009 0 17 2 11 4 73 0.67 1758867 1.93 0.23 1.25 28
2008 0 21 4 10 7 227 0.70 1766577 2.38 0.45 1.13 46
2007 0 20 2 10 8 23 0.70 1543176 2.59 0.26 1.30 46

Cleveland is committed to providing all personnel the tools, education and training they need to create the safest work environment possible. We all have family and friends who care about us, so we take seriously our responsibility to keep our employees and the partners that support us safe. Everyone at Cleveland is actively engaged in the process. We empower ALL employees to make decisions to correct any unsafe conditions regardless of the situation.

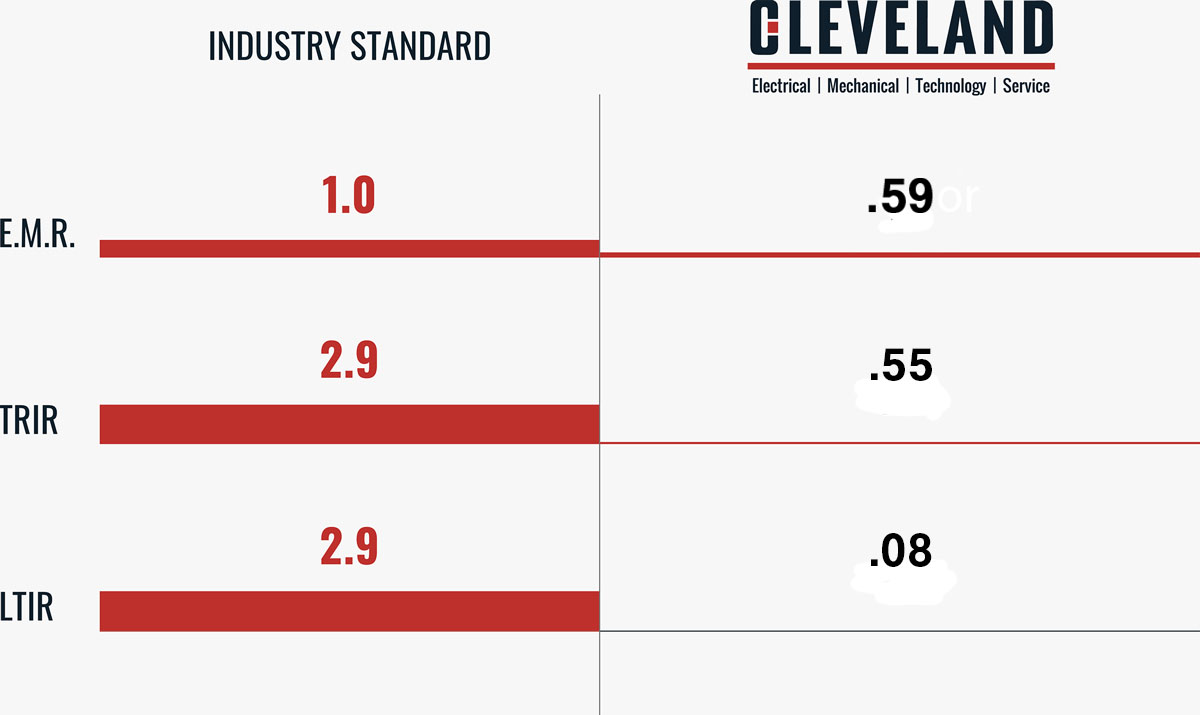
At Cleveland, we are very proud of our passion for safety. Our numerous awards and industry-leading safety statistics are the result of this passion and our desire to ensure every coworker and partner gets home safely each day.